Image Details
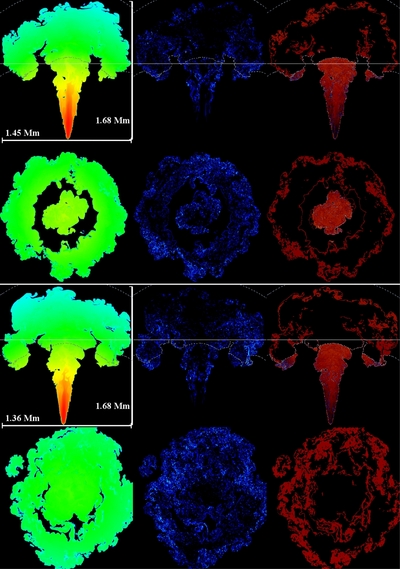
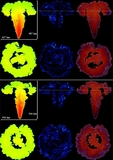
Caption: Figure 8.
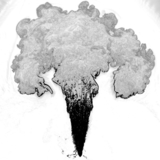
Same comparison of Model AV (top) with Model A0 (bottom) as Figure 6 but at t = 0.75 s. The columns are, from left to right, temperature (blue through orange), magnitude of vorticity (blue through white), and energy generation rate (blue for negative values, red for positive). The thin, horizontal white line in the first row of each panel indicates the location of the orthogonal slice shown in the bottom row of each panel. The top row of each panel has an aspect ratio given by the dimensions shown; the bottom rows have an aspect ratio of unity, with the scale given by the width shown. The dotted gray lines are contours of density with the inner at ρ = 10 8 g cm −3 and the outer at ρ = 10 7 g cm −3.
Other Images in This Article
Show More
Copyright and Terms & Conditions
© 2014. The American Astronomical Society. All rights reserved.