Image Details
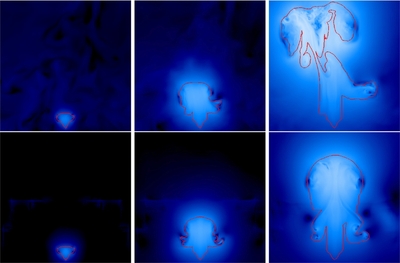
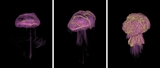
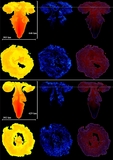
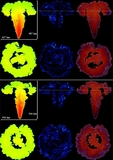
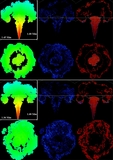
Caption: Figure 13.
Slices in the YZ plane for Models BV (top row) and B0 (bottom row) at t = 0.1, 0.2, and 0.3 s, from left to right. The red line is the X(C 12) = 0.45 isocontour marking the flame surface. The color plot is the fluid speed, which spans, logarithmically, from less than 10 km s −1 (black) to 10 4 km s −1 (white). The center of the bottom edge of each panel is at the center of the white dwarf, and all panels have a spatial scale of 280 km on a side. For the BV models (top row), there is a significant non-radial component to the velocity field, as evident by distortion of the flame surface to the upper left of the frames.
Other Images in This Article


Show More
Copyright and Terms & Conditions
© 2014. The American Astronomical Society. All rights reserved.