Image Details
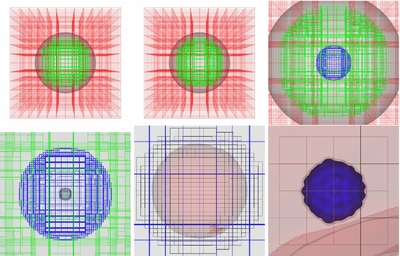
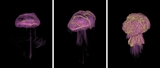
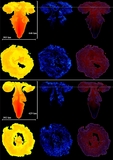
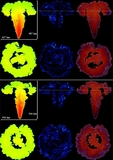
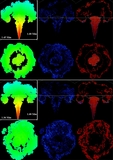
Caption: Figure 2.
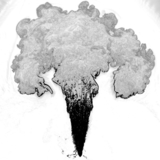
Grid layout with each additional level of refinement; each box represents a block of 16 3 to 48 3 zones, depending on the size. The top left figure shows the grid structure for the N12 calculation in Maestro, and the top center figure shows this grid after 20 coarse time steps in Castro. The red and green lines indicate the base (8.68 km zone −1) and first (4.34 km zone −1) levels; the gray contour is an isodensity surface at ρ = 10 4 g cm −3. The next two plots zoom in on the next two levels of refinement, with blue (black) at ~1085 (~271) m zone −1. The next plot shows the final level of refinement in brown at ~135 m zone −1 and a density contour in red at ρ = 10 9 g cm −3. The region of ignition is evident in the southeast quadrant. The final figure is a zoom in on the added ignition point where the carbon mass fraction is shown as a blue contour.
Other Images in This Article
Show More
Copyright and Terms & Conditions
© 2014. The American Astronomical Society. All rights reserved.