Image Details
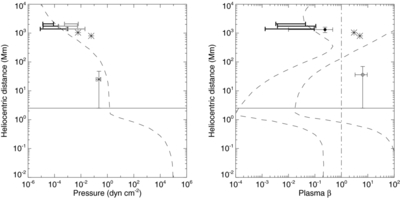
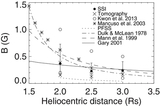
Caption: Figure 9.
Radial profiles of pressures and plasma β. The horizontal solid lines in both panels refer to the typical height of the lower boundary of the solar corona, 2.5 Mm. The dashed curves denote plasma pressure (left panel) and plasma β (right) above an active region, modeled in Gary (2001). In the left panel, thick black and gray error bars represent the full ranges of plasma pressure and magnetic pressure, respectively, determined in the present work, at heliocentric distances 2.0, 2.5, and 3.0 R ☉. The asterisks are plasma pressure in a coronal helmet streamer determined at 1.15 and 1.5 R ☉ (Li et al. 1998). The "x" with error bars represents plasma pressure on coronal loops observed by TRACE 171 Å (Kwon & Chae 2008). In right panel, thick black error bars show the full ranges of plasma β determined in the present work at the heliocentric distances. The closed circle refers to plasma β in a heliocentric distance range of 1.5–2.3 R ☉ in coronal streamers above coronal active regions (Mancuso et al. 2003). The asterisks are plasma β in a coronal helmet streamer determined at 1.15 and 1.5 R ☉ (Li et al. 1998). The open circle and error bars represent plasma β determined with kinematics of an EIT wave in the low solar corona (West et al. 2011). The vertical dash-dotted line denotes the unity of plasma β.
Other Images in This Article
Copyright and Terms & Conditions
© 2013. The American Astronomical Society. All rights reserved.