Image Details
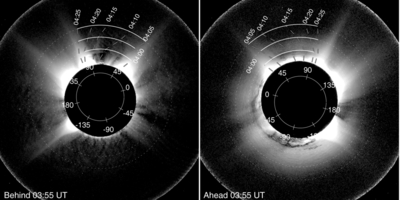
Caption: Figure 1.
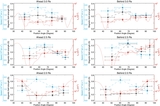
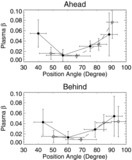
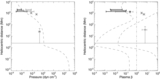
Total brightness images observed at 03:50 UT by the COR1 inner coronagraphs Behind (left) and Ahead (right). The dashed curves show wave fronts detected on the subsequent images taken from 04:00 to 04:25 UT with a time cadence of five minutes. The solid circles inside the occulting disks demarcate the solar disk and the figures along the circles indicate the position angles of which the origins are at the flare sites projected on the image planes. The dotted circles represent heliocentric distances at 2.0, 2.5, and 3.0 R ☉ and the solid curves as parts of the dotted circles indicate sections where the disturbance passes through and physical parameters are determined.
Other Images in This Article
Copyright and Terms & Conditions
© 2013. The American Astronomical Society. All rights reserved.