Image Details
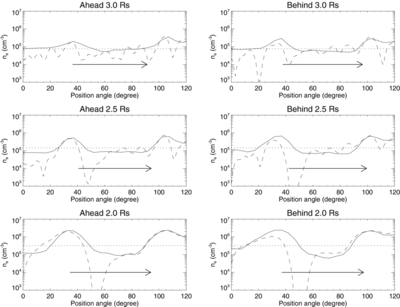
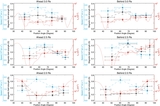
Caption: Figure 2.
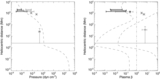
Azimuthal profiles of electron density along three circular paths at heliocentric distances of 2.0 (bottom), 2.5 (middle), and 3.0 R ☉ (top) on the image planes of Ahead (left) and Behind (right). The electron densities are determined with the SSI (solid curve) and tomography (dashed) methods, within a position angle range from 0° to 120°. The dotted horizontal lines refer to the electron densities determined in polar coronal holes by Saito et al. (1977). The line segments represent the sections that correspond to the solid curves in Figure 1.
Other Images in This Article
Copyright and Terms & Conditions
© 2013. The American Astronomical Society. All rights reserved.
Copyright ©
2025 Astronomy Image Explorer. All Rights Reserved.