Image Details
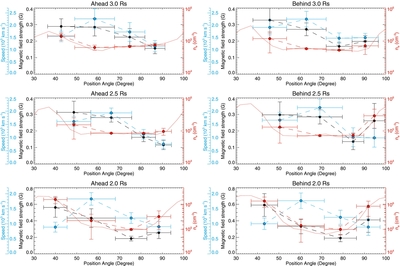
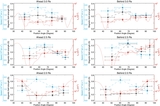
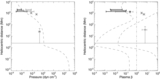
Caption: Figure 4.
Magnetic field strengths (black) at heliocentric distances 2.0 (bottom), 2.5 (middle), and 3.0 R ☉ (top) on the image planes taken from Ahead (left) and Behind (right), derived from speeds (blue) of the disturbance, electron densities (red), and a constant sound speed. The electron densities were measured with the SSI method. Abscissas are position angles as seen in Figures 1 and 2. The red solid curves represent the azimuthal profiles of the electron density. The red dashed lines with circles and vertical error bars refer to the averages and standard deviations over sections indicated by horizontal error bars. The horizontal error bars indicate sections where the disturbance passes through during the time intervals of the pB images.
Other Images in This Article
Copyright and Terms & Conditions
© 2013. The American Astronomical Society. All rights reserved.