Image Details
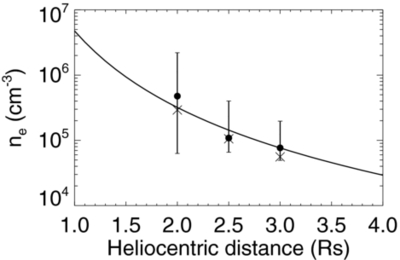
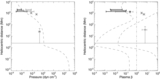
Caption: Figure 3.
Radial profile of electron density. The electron densities determined with the SSI and tomography methods are averaged over the sections represented by the line segments in Figure 2. The values are shown as circles and crosses respectively. The error bars represent the full ranges of the electron densities within the sections, determined with the SSI method. The solid curve refers to an electron density profile in polar coronal holes determined in Saito et al. (1977).
Other Images in This Article
Copyright and Terms & Conditions
© 2013. The American Astronomical Society. All rights reserved.
Copyright ©
2025 Astronomy Image Explorer. All Rights Reserved.