Image Details
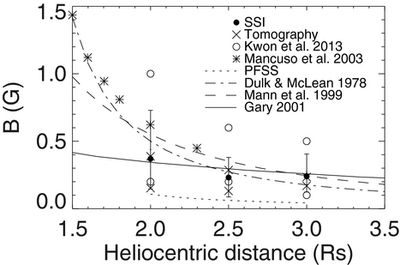
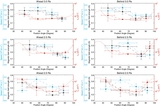
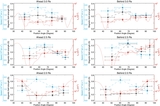
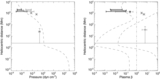
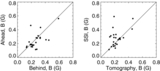
Caption: Figure 7.
Radial profiles of magnetic field strength. The closed circles and error bars denote the averages and the full ranges of magnetic field strengths, respectively, determined with the SSI method. The ranges of magnetic field strengths determined with the tomography method are represented by crosses. The open circles refer to the ranges of magnetic field strengths determined in Kwon et al. (2013). The asterisks denote the magnetic field strengths determined with speeds of type II radio bursts (Mancuso et al. 2003). The dotted curves refer to an average of magnetic field strengths, determined with a PFSS model, over 30° around the solar rotational axis. Empirical profiles of magnetic field strengths above the quiet Sun (Mann et al. 1999) and an active region (Dulk & McLean 1978) are shown with dashed and dash-dotted curves, respectively. The solid curve refers to a modeled radial profile of magnetic field strength used for modeling plasma β above an active region (Gary 2001).
Other Images in This Article
Copyright and Terms & Conditions
© 2013. The American Astronomical Society. All rights reserved.