Image Details

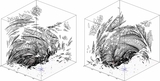
Caption: Figure 11.
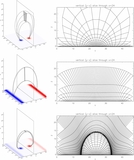
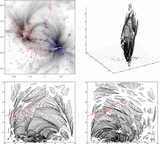
Sketch of two flux tubes (top left) and the renderings of the corresponding synthetic coronal loops in the x − y, y − z, and x − z projections (as marked). The field lines forming these tubes were initiated as two regular hexagons at the opposite polarities. The renderings show the emission measure corresponding to a hydrostatic atmosphere with scale height of 40 pixels. The apex of loop 1 is marked as a red triangle and the apex of loop 2 is marked as a blue square in all renderings. Note that loop 1 appears brighter and non-expanding in the x − y projection, while the opposite occurs in the x − z projection; see Figures 13– 15 for the numerical justification. In fact, given these two projections alone, it is easy to mistakenly believe that there are two loops, where one is wide and expanding and the other one is thin and non-expanding. In fact, the two loops have similar radii and they both expand—but in different directions. Note also how the projection effect impacts the perceived density scale height.
Other Images in This Article

Show More
Copyright and Terms & Conditions
© 2013. The American Astronomical Society. All rights reserved.