Image Details
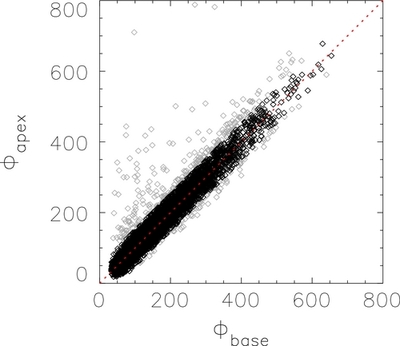
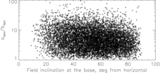
Caption: Figure 7.
Comparison of flux at the base and the flux at the apex for the six-sided flux tubes. This plot demonstrates that flux is well conserved for most of the "tubes" and therefore the approximation we make for their cross-sectional shape holds for most of them. For further analysis, we discard those tubes for which the fluxes differ by more than 50 G pixel 2 (414 flux tubes out of a total of 9050, or about 5%). The 414 discarded points are plotted in gray and the remaining points are plotted in black.
Other Images in This Article

Show More
Copyright and Terms & Conditions
© 2013. The American Astronomical Society. All rights reserved.
Copyright ©
2025 Astronomy Image Explorer. All Rights Reserved.