Image Details
Caption: Figure 5.
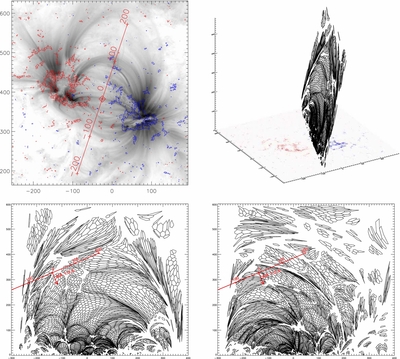
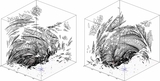
Mapping of field lines from the lower boundary to a vertical plane in a manner similar to Figure 4. In this case, the field lines were initiated from corners of regular hexagons at the lower boundary. The plane was set by the Atmospheric Imaging Assembly (AIA) l.o.s. and an arbitrary line in the plane of the sky that visually passes through the tops of many loops (the red line in the top left panel). The top left panel shows the AIA 171 Å image and the corresponding HMI magnetogram. The top right panel shows the position of this plane in the 3D computational domain. The points at which the field lines cross this plane are calculated and plotted for the field lines initiated from negative (bottom left) and positive (bottom right) polarities at the lower boundary. Adjacent points are connected to form polygons—these would correspond to cross sections of flux tubes in the active region, should these flux tubes be regular hexagons at the lower boundary. The gaps in the plots reflect that we did not trace field lines from where | Bz| was below a 100 G threshold. We encourage readers of the electronic edition to zoom in the two bottom panels to examine the cross sections of the low-lying flux tubes. Very few flux tubes could still be described as regular hexagons at the apices (here, we mean more of a qualitative description of a visual impression; we make quantitative estimates in Section 3). As we argue in Section 4, this fact may have substantial impact on the visibility of the corresponding coronal loops.
Other Images in This Article

Show More
Copyright and Terms & Conditions
© 2013. The American Astronomical Society. All rights reserved.