Image Details
Caption: Figure 8.
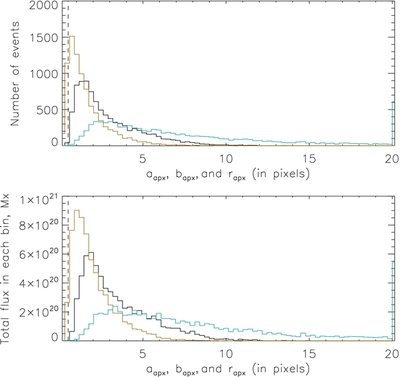
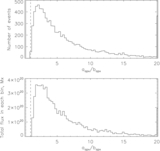
Statistics of the apex expansion in the elongated (cyan) and shortened (orange) directions. The top plot shows the number
of flux tubes that fall in the
a
apx and
b
apx bins and the bottom plot shows the total flux in each bin. The black curve for each plot corresponds to what the expansion
would have been if the cross section was circular, that is, it corresponds to
 . The cross-sectional radius at the base is
r
0 =
a
0 =
b
0 = 0.5 pixels and is shown with a dashed vertical line.
. The cross-sectional radius at the base is
r
0 =
a
0 =
b
0 = 0.5 pixels and is shown with a dashed vertical line.
Other Images in This Article

Show More
Copyright and Terms & Conditions
© 2013. The American Astronomical Society. All rights reserved.
Copyright ©
2025 Astronomy Image Explorer. All Rights Reserved.