Image Details
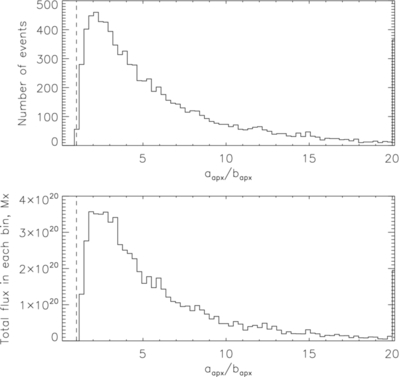
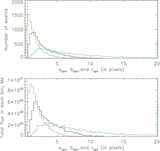
Caption: Figure 9.
Statistics of the shape of the flux tubes at their apices. The top plot shows the number of flux tubes that fall in the a apx/ b apx bins and the bottom plot shows the total flux in each bin. The dashed vertical lines mark unity.
Other Images in This Article


Show More
Copyright and Terms & Conditions
© 2013. The American Astronomical Society. All rights reserved.
Copyright ©
2025 Astronomy Image Explorer. All Rights Reserved.