Image Details
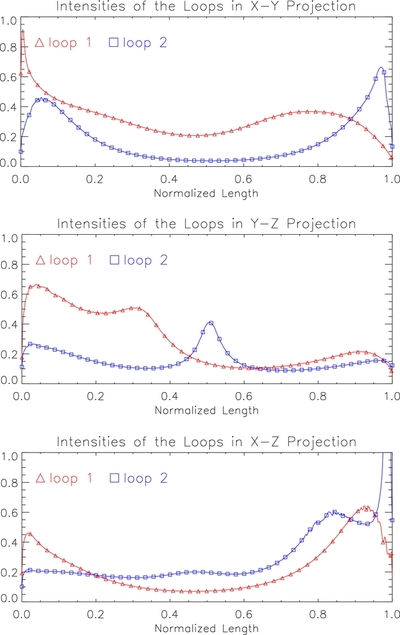
Caption: Figure 13.
Intensities of loops 1 and 2 (when rendered separately) in different projections along their axes; we took advantage of the fact that the flux tubes have similar lengths and plotted intensity vs. normalized length units. Note that loop 1 is brighter in the x − y projection at the apex while loop 2 is brighter at the apex in the x − z projection. Note also the intensity peak at the loop top of loop 2 in the y − z projection. It is a real loop top feature, and we will return to it further in the text.
Other Images in This Article


Show More
Copyright and Terms & Conditions
© 2013. The American Astronomical Society. All rights reserved.
Copyright ©
2025 Astronomy Image Explorer. All Rights Reserved.