

Image Details
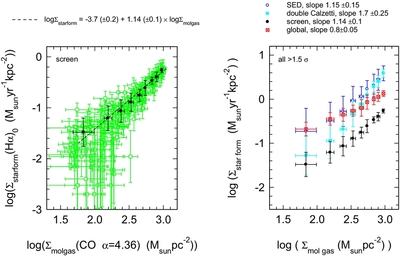
Caption: Figure 8.
Spatially resolved molecular KS relation in EGS 13011166. Left panel: green circles (and ±1σ uncertainties) denote CO-inferred
molecular gas surface densities (horizontal) and the mixed-extinction/effective single screen corrected Hα-star formation
rates (with a "single Calzetti" screen; Calzetti et al. 2000) for each 0
 25 × 0
25 pixel in the map. Black filled circles and crosses denote the weighted binned medians of the individual pixel values and
their dispersions. The dotted black line is the best-fit weighted linear regression to the green data, which yields a slope
N = 1.14 ± 0.1. Right panel: binned weighted medians of the KS relations for other extinction correction methods: filled black
circles denote the mixed case for an effective single Calzetti screen (
N = 1.14 ± 0.1; the same as in the left panel); crossed red squares denote the global extinction correction method (
N = 0.8 ± 0.05); the filled cyan squares mark a "double Calzetti" screen correction with an extra factor 2.27 for the nebular
over the stellar extinction (
N = 1.7 ± 0.25); and open blue circles show the correlation for the direct broadband SED modeling (without using the Hα data)
of the star formation rate surface density (
N = 1.15 ± 0.15).
25 × 0
25 pixel in the map. Black filled circles and crosses denote the weighted binned medians of the individual pixel values and
their dispersions. The dotted black line is the best-fit weighted linear regression to the green data, which yields a slope
N = 1.14 ± 0.1. Right panel: binned weighted medians of the KS relations for other extinction correction methods: filled black
circles denote the mixed case for an effective single Calzetti screen (
N = 1.14 ± 0.1; the same as in the left panel); crossed red squares denote the global extinction correction method (
N = 0.8 ± 0.05); the filled cyan squares mark a "double Calzetti" screen correction with an extra factor 2.27 for the nebular
over the stellar extinction (
N = 1.7 ± 0.25); and open blue circles show the correlation for the direct broadband SED modeling (without using the Hα data)
of the star formation rate surface density (
N = 1.15 ± 0.15).
Other Images in This Article
Copyright and Terms & Conditions
© 2013. The American Astronomical Society. All rights reserved.

