

Image Details
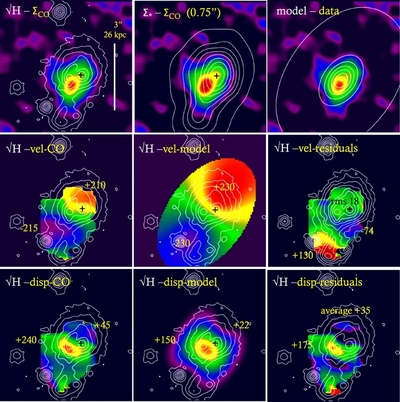
Caption: Figure 4.
Molecular gas derived kinematics and disk models in EGS 13011166 (all from ABC-configuration data at 0
 7 × 0
8 FWHM resolution). Top row: CO-integrated flux map in color with white contour maps (from left to right) and the 0
3 FWHM
HST WFC3, stellar mass (as inferred from SED fitting, 0
75 FWHM) and mass distribution of the best exponential fit model. The middle row shows the CO velocity map (left), the model
velocity map (center), and the data minus model residual map, with superpose white contours of the 0
3 FWHM
HST WFC3 map. The bottom row shows the same overlays for the dispersion maps. The black cross denotes the position of the
H-band peak that is ~0
4(±0
1) ESE of the stellar mass and star formation rate peaks. Numbers in the individual panels give minimum and maximum values
of the color maps, as well as rms and average values of velocity residuals and velocity dispersion residuals.
7 × 0
8 FWHM resolution). Top row: CO-integrated flux map in color with white contour maps (from left to right) and the 0
3 FWHM
HST WFC3, stellar mass (as inferred from SED fitting, 0
75 FWHM) and mass distribution of the best exponential fit model. The middle row shows the CO velocity map (left), the model
velocity map (center), and the data minus model residual map, with superpose white contours of the 0
3 FWHM
HST WFC3 map. The bottom row shows the same overlays for the dispersion maps. The black cross denotes the position of the
H-band peak that is ~0
4(±0
1) ESE of the stellar mass and star formation rate peaks. Numbers in the individual panels give minimum and maximum values
of the color maps, as well as rms and average values of velocity residuals and velocity dispersion residuals.
Other Images in This Article
Copyright and Terms & Conditions
© 2013. The American Astronomical Society. All rights reserved.

