

Image Details
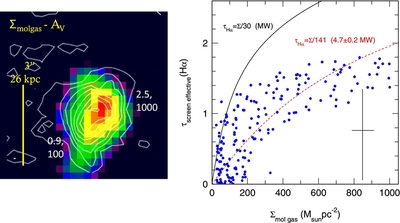
Caption: Figure 7.
Comparison of effective screen extinction, as inferred from SED analysis of the four-band
HST images, and the CO molecular gas mass surface density Σ
mol gas. Left panel: comparisons of the two-dimensional distributions (CO in white contours,
A(
V) in color) at the same FWHM resolution of ~0
 75, and sampled on a 0
25 grid. Right panel: pixel-by-pixel correlation between molecular column density (horizontal scale) and effective screen
optical depth at Hα (τ(Hα) = 0.73 ×
A(
V); Calzetti et al. 2000), with a typical uncertainty marked as a black cross. The black and dotted red curves are models for
a homogenous mixture of gas, dust, and stars, where τ
effective screen(Hα) = ln ((Σ
mol gas/30
b)/{1 − exp (− (Σ
mol gas/30
b))}), where
b is the ratio of total molecular gas column to Hα optical depth in units of the diffuse Galactic ISM value (Σ/τ(Hα))
MW ISM = 30
M
☉ pc
−2, or (
N(H)/
A(
V))
MW ISM = 2 × 10
21 cm
−2 mag
−1 (Bohlin et al. 1978; see also Wuyts et al. 2011a; Nordon et al. 2013). The best-fitting curve has
b = 4.7 ± 0.3, in good agreement with the findings of Nordon et al. (2013) for
z ~ 1–3 main-sequence galaxies observed in the UV, Herschel PACS, and CO.
75, and sampled on a 0
25 grid. Right panel: pixel-by-pixel correlation between molecular column density (horizontal scale) and effective screen
optical depth at Hα (τ(Hα) = 0.73 ×
A(
V); Calzetti et al. 2000), with a typical uncertainty marked as a black cross. The black and dotted red curves are models for
a homogenous mixture of gas, dust, and stars, where τ
effective screen(Hα) = ln ((Σ
mol gas/30
b)/{1 − exp (− (Σ
mol gas/30
b))}), where
b is the ratio of total molecular gas column to Hα optical depth in units of the diffuse Galactic ISM value (Σ/τ(Hα))
MW ISM = 30
M
☉ pc
−2, or (
N(H)/
A(
V))
MW ISM = 2 × 10
21 cm
−2 mag
−1 (Bohlin et al. 1978; see also Wuyts et al. 2011a; Nordon et al. 2013). The best-fitting curve has
b = 4.7 ± 0.3, in good agreement with the findings of Nordon et al. (2013) for
z ~ 1–3 main-sequence galaxies observed in the UV, Herschel PACS, and CO.
Other Images in This Article
Copyright and Terms & Conditions
© 2013. The American Astronomical Society. All rights reserved.

