

Image Details
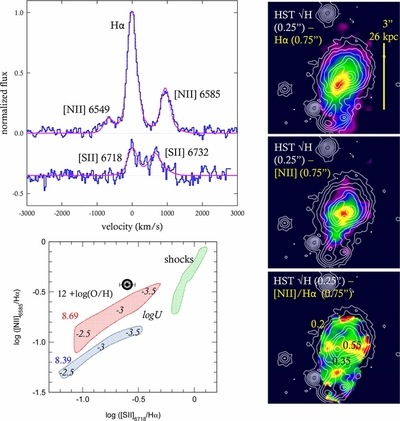
Caption: Figure 3.
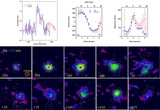
LUCI spectroscopy. Top left: integrated spectrum of EGS 13011166, after removing pixel-by-pixel velocity shifts due to the large-scale rotation. It shows Hα, [N ii] and [S ii] emission lines (blue). The line profile cannot be fit by a single Gaussian. The pink curve is the best fit, double Gaussian profile for all five lines: a "narrow" component of Δ v FWHM = 293(±11) km s −1, and flux ratios [N ii] 6585/Hα = 0.37 ± 0.01, [S ii] 6718/Hα = 0.25 ± 0.04 and [S ii] 6718/[S ii] 6732 ~ 1.3(+0.8, −0.1), and a "broad" component with Δ v FWHM = 680 (±80) km s −1 and flux ratio ( F broad/ F narrow)(Hα) = 0.48(±0.13). The broad component is also present in the [N ii] and [S ii] lines. Bottom left: location of ESG13011166 in the [N ii]/Hα and [S ii]/Hα-plane (adapted from Newman et al. 2012b), along with photo-ionization and shock models. The spatially integrated value for EGS 13011166 (large black circle) is well fit with solar metallicity photoionization models with ionization parameter log U ~ −3.2. Right: overlays the HST H-band map (white contours) on the integrated Hα flux map (top), integrated [N ii] 6585 flux map (middle), and [N ii] 6585/Hα flux ratio map (bottom).
Other Images in This Article
Copyright and Terms & Conditions
© 2013. The American Astronomical Society. All rights reserved.

