

Image Details
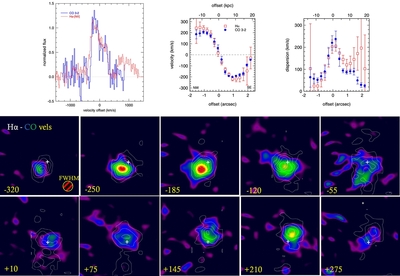
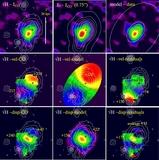
Caption: Figure 6.
Comparison of CO and Hα data at the same resolution of FWHM 0
 75. The top left panel is a comparison of the integrated, normalized CO (blue) and Hα (red) spectral profiles, with an instrumental
resolution of FWHM 22 km s
−1 (CO) and 100 km s
−1 (Hα). The bumps at +940 and −670 km s
−1 in the Hα spectrum are due to [N ii]. Top central and right panels: velocity dispersion and velocity (and ±1σ error) in a
software slit of 1'' width, from Gaussian fitting along the major kinematic axis (position angle 36° west of north) in CO
(blue) and Hα (red). Central and bottom rows: velocity channel maps (width ~65 km s
−1) in Hα (contours) and CO (color), sampled onto a 0
06 pixel
−1 grid.
75. The top left panel is a comparison of the integrated, normalized CO (blue) and Hα (red) spectral profiles, with an instrumental
resolution of FWHM 22 km s
−1 (CO) and 100 km s
−1 (Hα). The bumps at +940 and −670 km s
−1 in the Hα spectrum are due to [N ii]. Top central and right panels: velocity dispersion and velocity (and ±1σ error) in a
software slit of 1'' width, from Gaussian fitting along the major kinematic axis (position angle 36° west of north) in CO
(blue) and Hα (red). Central and bottom rows: velocity channel maps (width ~65 km s
−1) in Hα (contours) and CO (color), sampled onto a 0
06 pixel
−1 grid.
Other Images in This Article
Copyright and Terms & Conditions
© 2013. The American Astronomical Society. All rights reserved.

