

Image Details
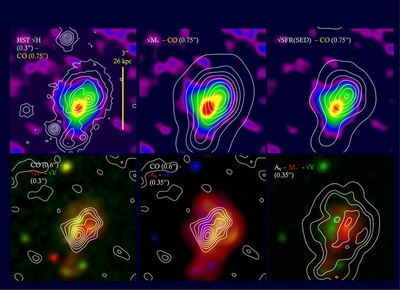
Caption: Figure 2.
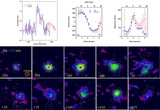
Comparison of images. Top row: integrated CO flux map in color (ABC-configurations, 0
 7 × 0
8 FWHM) and (left) WFC3
HST H-band map as white contours, ~0
3 FWHM; (center) inferred stellar mass distribution from SED fitting white contours, 0
75 FWHM; and (right) extinction-corrected star formation rate distribution inferred from SED fitting (white contours, 0
75 resolution). Bottom row: (left) CO-integrated flux map in white contours (AB-configuration, 0
56 × 0
68 FWHM) and
HST WFC3
H-band map (red, 0
3 FWHM) and ACS
V-band map (green, 0
3 FWHM), (center) CO-integrated flux map in white contours, (AB-configuration, 0
56 × 0
68 FWHM) and
HST A
V-map (red, 0
35 FWHM) and (right) ACS
V-band map (blue, 0
35 FWHM). (Right)
HST ACS
V-band (green), and
A
V-map in white contours and stellar mass map (red), both inferred from SED modeling. All
HST maps are smoothed to 0
35 FWHM. The pixel scale is 0
06.
7 × 0
8 FWHM) and (left) WFC3
HST H-band map as white contours, ~0
3 FWHM; (center) inferred stellar mass distribution from SED fitting white contours, 0
75 FWHM; and (right) extinction-corrected star formation rate distribution inferred from SED fitting (white contours, 0
75 resolution). Bottom row: (left) CO-integrated flux map in white contours (AB-configuration, 0
56 × 0
68 FWHM) and
HST WFC3
H-band map (red, 0
3 FWHM) and ACS
V-band map (green, 0
3 FWHM), (center) CO-integrated flux map in white contours, (AB-configuration, 0
56 × 0
68 FWHM) and
HST A
V-map (red, 0
35 FWHM) and (right) ACS
V-band map (blue, 0
35 FWHM). (Right)
HST ACS
V-band (green), and
A
V-map in white contours and stellar mass map (red), both inferred from SED modeling. All
HST maps are smoothed to 0
35 FWHM. The pixel scale is 0
06.
Other Images in This Article
Copyright and Terms & Conditions
© 2013. The American Astronomical Society. All rights reserved.

