Image Details
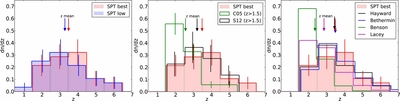
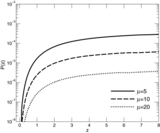
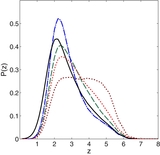
Caption: Figure 9.
Left: redshift distribution of strongly lensed DSFGs derived from our molecular line survey. The red histogram shows the z-distributions for the SPT sources using the most likely redshift identification for the sources with ambiguous redshifts; the blue histogram shows the same for the lowest redshift identification of these five sources (see Table 2). Middle: redshift distribution of radio-identified DSFGs with spectroscopic redshifts at z > 1.5 (green; Chapman et al. 2005; Capak et al. 2008; Coppin et al. 2009; Daddi et al. 2009a, 2009b; Riechers et al. 2010; Banerji et al. 2011; Walter et al. 2012), mm-identified DSFGs with photometric redshifts at z > 1.5 from (black; Smolcic et al. 2012), compared to the most likely SPT distribution (red). Right: redshift distributions from the models of Hayward et al. (2012; black), Béthermin et al. (2012; blue), Benson (2012; green), Lacey et al. (2010; purple) for z > 1.5, compared to the most likely SPT distribution (red). The arrows in all panels show the mean redshift of each distribution. In all panels the histograms are calculated over the same redshift bins but are plotted with slight shifts in z for clarity.
Other Images in This Article
Show More
Copyright and Terms & Conditions
© 2013. The American Astronomical Society. All rights reserved.