Image Details
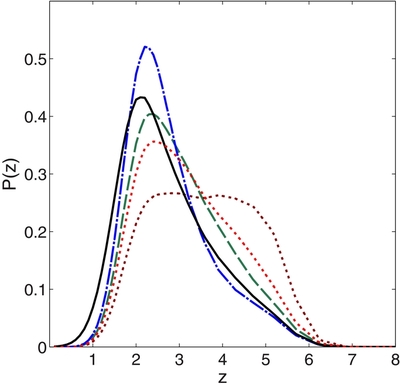
Caption: Figure 7.
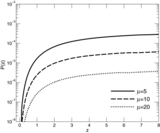
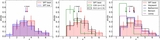
Comparison between an assumed intrinsic redshift distribution ( dn/ dz, solid black) consistent with spectroscopic observations (see text for references) and distributions modified by gravitational lensing (using the models described in Hezaveh & Holder 2011) under different size evolution scenarios. The green dashed line shows the bias to the redshift distribution due to gravitational lensing assuming no size evolution versus redshift. The blue dot-dashed line show the bias to the redshift distribution due to gravitational lensing if the size of DSFGs increases with redshift, from r = 1 kpc at z = 2 to 3 kpc at z = 5. The red dotted line shows the bias of the redshift distribution due to gravitational lensing if the size of DSFGs decreases moderately with redshift ( r = 2.5 kpc at z = 2 as measured for DSFGs (Engel et al. 2010), to r = 1.5 kpc at z = 6 using the measured submm QSO host sizes (Walter et al. 2009) as lower bound to the size of DSFGs). The maroon dotted line exemplifies the extreme size evolution which would be required to bring the redshift distribution of Chapman et al. (2005) into agreement with our observations ( r = 2.5 kpc at z = 2 to r = 0.2 kpc at z = 6).
Other Images in This Article
Show More
Copyright and Terms & Conditions
© 2013. The American Astronomical Society. All rights reserved.