Image Details
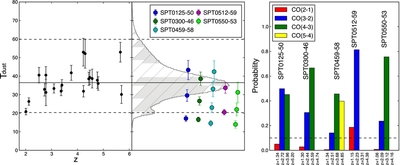
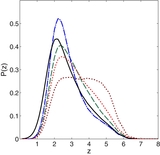
Caption: Figure 4.
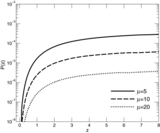
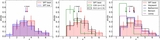
Left: dust temperatures for the sources in our sample with unambiguous redshifts. Center: combined histogram of dust temperatures derived from the posterior likelihood distributions for the sources with unambiguous redshifts. Overplotted are the dust temperatures determined for each redshift option for those sources with uncertain redshift; horizontal spacing is arbitrary. The solid and dashed lines show the median and 95% confidence interval dust temperatures for those sources with unambiguous redshifts. Right: probability for the single line detected in our ALMA spectrum to be identified as one of the four possible CO transitions for the five sources with ambiguous redshifts. The probabilities were calculated by comparing the dust temperature associated with each line identification to the dust temperature distribution of our sources with known redshifts. The horizontal dashed line shows a probability of 10%, the cut off above which we consider the line identification to be plausible.
Other Images in This Article
Show More
Copyright and Terms & Conditions
© 2013. The American Astronomical Society. All rights reserved.