Image Details
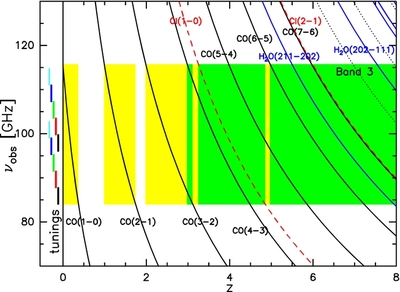
Caption: Figure 2.
Spectral coverage of the CO, [C i], and H 2O emission lines as a function of redshift. The green shaded region marks the redshifts where two or more strong lines provide an unambiguous redshift, while the yellow region marks redshift range where only a single line is detectable. The five frequency tunings are shown in the left panel (see also Figure 1).
Other Images in This Article
Show More
Copyright and Terms & Conditions
© 2013. The American Astronomical Society. All rights reserved.
Copyright ©
2025 Astronomy Image Explorer. All Rights Reserved.