Image Details
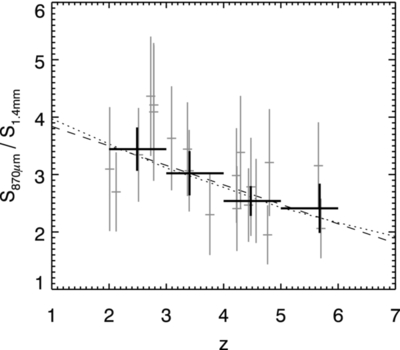
Caption: Figure 8.
Observed 870 μm to 1.4 mm flux density ratio as a function of redshift for our sample of 20 sources with unambiguous spectroscopic redshifts. The gray points show the individual measurements and their error bars taking absolute calibration uncertainties into account. The black crosses show the mean flux density ratio in redshift bins of Δ z = 1 centered at the weighted mean z. The dashed line is a linear fit to the data S 870 μm/ S 1.4 mm = 4.18–0.34 z for z = 2–6). The dotted line shows the expectation for a Arp-220-like dust SED.
Other Images in This Article
Show More
Copyright and Terms & Conditions
© 2013. The American Astronomical Society. All rights reserved.
Copyright ©
2025 Astronomy Image Explorer. All Rights Reserved.