Image Details
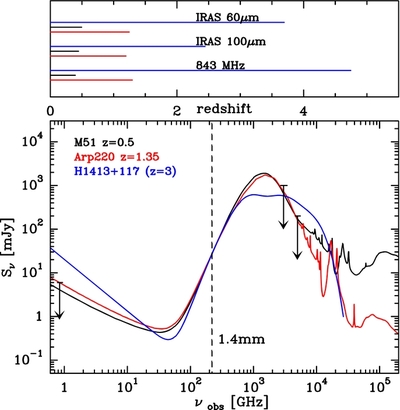
Caption: Figure 5.
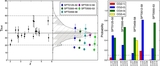
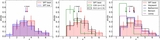
Top: redshift bias due to our IRAS 60 and 100 μm, and 843 MHz radio flux vetos. The bars show the redshift range for which specific radio-to-IR SEDs are excluded from our sample. The color coding of the bars corresponds to galaxies shown in the bottom part of the figure. Bottom: radio to optical SEDs of M51 (the Whirlpool Galaxy), Arp 220 (the nearest ultraluminous infrared galaxy) and H1413+117 (the Cloverleaf QSO). These galaxies represent a range of possible SED types and are normalized to S 1.4 mm = 28 mJy (the mean 1.4 mm flux density of our sample). The dashed horizontal line shows our selection wavelength of 1.4 mm. The arrows show the 843 MHz, 100 μm and 60 μm upper limits used for our source selection. The SEDs are shown for the lowest redshift (value indicated in the figure) for which each source matches our selection criteria, except for H1413+117 which is shown at z = 3.0.
Other Images in This Article
Show More
Copyright and Terms & Conditions
© 2013. The American Astronomical Society. All rights reserved.