Image Details
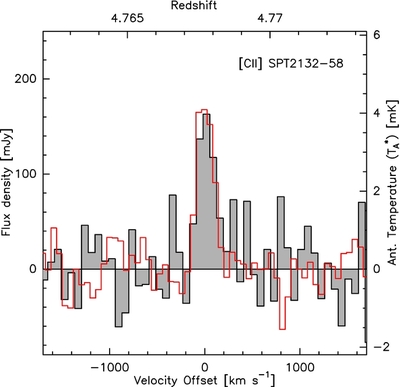
Caption: Figure 15.
APEX/FLASH spectrum of SPT 2132-58 showing the [C ii] λ158 μm line (filled histogram) confirming the single ALMA line as CO(5–4) (red line, scaled to allow for a comparison between the line profiles) at z = 4.7677.
Other Images in This Article
Show More
Copyright and Terms & Conditions
© 2013. The American Astronomical Society. All rights reserved.
Copyright ©
2025 Astronomy Image Explorer. All Rights Reserved.