Image Details
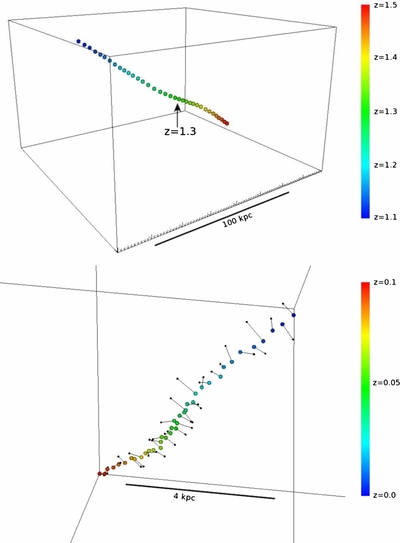
Caption: Figure 8.
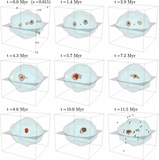
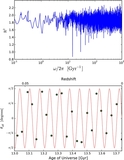
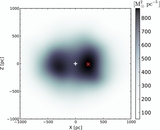
Visualizations of the motion of the potential minimum in Eris in absolute (code) units, color coded by redshift. Top: from z = 1.5 to z = 1.1. At z = 1.3 a satellite passes near to the center, but it does not noticeably perturb the dynamical center. Bottom: the last 40 outputs, from z = 0.1 down to z = 0. The location of the maximum DM density is marked with a small black sphere connected with a thin line to the position of the potential minimum at that time.
Other Images in This Article

Copyright and Terms & Conditions
© 2013. The American Astronomical Society. All rights reserved.
Copyright ©
2025 Astronomy Image Explorer. All Rights Reserved.