Image Details
Caption: Figure 5.
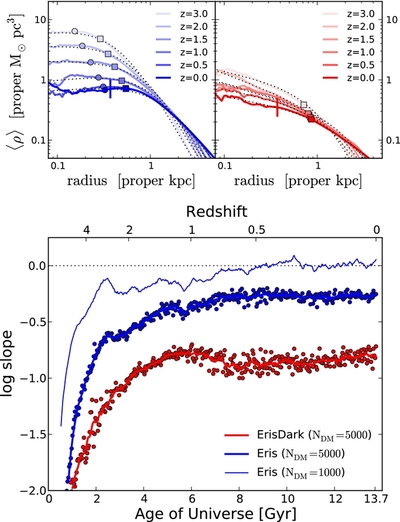
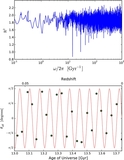
Evolution of the inner DM density profiles. Top: density profiles at
z = 3, 2, 1.5, 1, 0.5, and 0 for Eris (left) and ErisDark (right). All quantities are plotted in proper units. The black dotted
lines indicate the best-fitting modified Burkert profile (see Equation (1)). The location of
r
5000, the radius enclosing 5000 DM particles, is indicated with squares.
r
5000 corresponds to the density profile convergence radius in ErisDark at
z = 0. For Eris the density profile can be trusted to smaller radii due to its larger particle counts, and so we additionally
mark
r
1000 with a circle. The vertical bars indicate
r = 3
![]() soft. Bottom: the evolution of the logarithmic slope (
dln ρ/
dln
r) measured at different radii: the symbols and thick lines correspond to the slopes at
r
5000, and for Eris we also show the slope at
r
1000. All lines are boxcar averages over 10 outputs. This plot shows that baryonic physics in Eris leads to the flattening of
the central density profile. This flattening appears to be correlated with the growth of the DM offset (see Figure
4). We emphasize that
these slopes are not asymptotic slopes, and a value of less than −1 does not imply a strongly cusped profile all the way to the center, but merely indicates the
local slope at
r
5000, which may lie outside of the scale radius at early times.
soft. Bottom: the evolution of the logarithmic slope (
dln ρ/
dln
r) measured at different radii: the symbols and thick lines correspond to the slopes at
r
5000, and for Eris we also show the slope at
r
1000. All lines are boxcar averages over 10 outputs. This plot shows that baryonic physics in Eris leads to the flattening of
the central density profile. This flattening appears to be correlated with the growth of the DM offset (see Figure
4). We emphasize that
these slopes are not asymptotic slopes, and a value of less than −1 does not imply a strongly cusped profile all the way to the center, but merely indicates the
local slope at
r
5000, which may lie outside of the scale radius at early times.
Other Images in This Article

Copyright and Terms & Conditions
© 2013. The American Astronomical Society. All rights reserved.