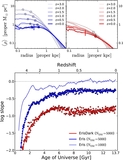
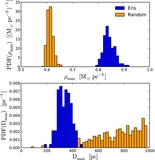
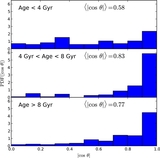
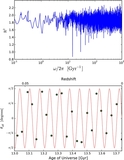
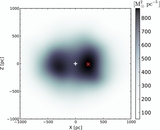
Image Details
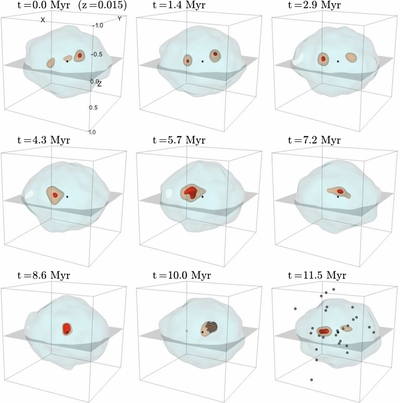
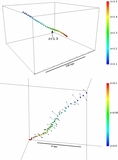
Caption: Figure 6.
3D contour plots of the DM density in the central (2 kpc)
3 volume of Eris. The outer contour (light blue) corresponds to ρ = 0.45
M
☉ pc
−3, the middle contour (light orange) to 0.8
M
☉ pc
−3, and the opaque innermost contour (red) to the 99th percentile of the DM density in the volume. The dynamical center is marked
with a black dot, and the stellar disk lies in the
X–
Y plane. The images show the time evolution over 11.5 Myr (Δ
t = 1.43 Myr) starting from
z = 0.0151. In the last two frames we have plotted the positions of all 78 particles located within 1
![]() soft of the maximum density at the second-to-last output shown. Only 1.43 Myr later (last frame) they have already dispersed throughout
the plotted volume, indicating that the density offset is not a bound structure.
soft of the maximum density at the second-to-last output shown. Only 1.43 Myr later (last frame) they have already dispersed throughout
the plotted volume, indicating that the density offset is not a bound structure.
Other Images in This Article

Copyright and Terms & Conditions
© 2013. The American Astronomical Society. All rights reserved.