Image Details
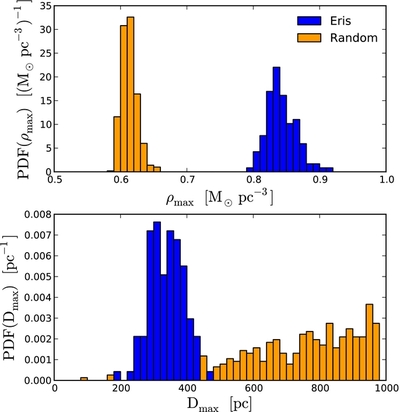
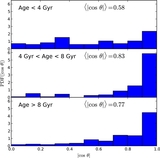
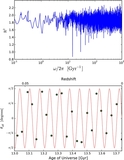
Caption: Figure 7.
Probability distribution functions of the maximum density ρ max (top panel) and its distance to the potential minimum D off (bottom), compared between the Eris simulation (blue) and random samples (orange). The Eris sample consists of the last ~124 outputs spanning 4 Gyr of evolution. The random sample is comprised of 500 realizations of a randomly drawn particle distributions with the same uniform mean density as the Eris core inward of 1 kpc.
Other Images in This Article

Copyright and Terms & Conditions
© 2013. The American Astronomical Society. All rights reserved.
Copyright ©
2025 Astronomy Image Explorer. All Rights Reserved.