Image Details
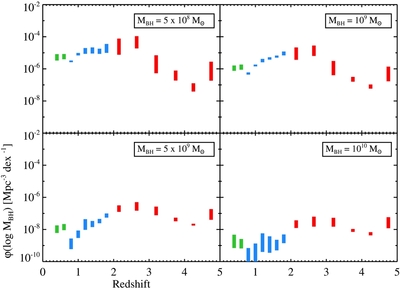
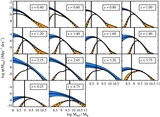
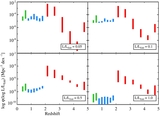
Caption: Figure 5.
Evolution in the comoving number densities of Type 1 quasars at four different values of M BH. The bars contain 68% of the posterior probability. The green bars denote bins with Hβ-based virial mass estimates, the blue bars denote bins with Mg ii-based mass estimates, and the red bars denote bins with C iv-based mass estimates. All of the bins show a peak in the number density around z ~ 2, with the higher mass bins falling off more steeply toward lower redshift and less steeply toward higher redshift, relative to the peak. The trend is commonly referred to as "downsizing."
Other Images in This Article
Show More
Copyright and Terms & Conditions
© 2013. The American Astronomical Society. All rights reserved.
Copyright ©
2026 Astronomy Image Explorer. All Rights Reserved.