Image Details
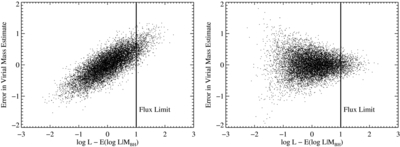
Caption: Figure 1.
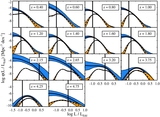
Illustration of the two models for the distribution of virial mass estimate errors used in this work. Mock data are generated using Equation (1). In both panels E(log L| M BH) denotes the mean value of log L at fixed M BH. The left panel shows a model with a luminosity-dependent bias (β > 0) and constant σ ml with luminosity, while the right panel shows a model with β = 0 and a decrease in the amplitude of the error in the mass estimates toward higher L. In both models the dispersion in virial estimates decreases when limited to only those quasars in the bright tail of the luminosity distribution. However, the virial mass estimates are also biased if the small dispersion in mass estimates observed in the SDSS is caused by the situation depicted in the left panel (β > 0).
Other Images in This Article
Show More
Copyright and Terms & Conditions
© 2013. The American Astronomical Society. All rights reserved.