Image Details
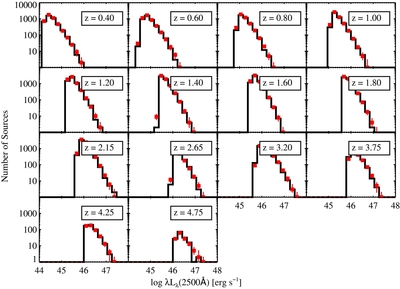
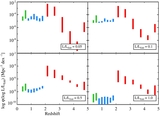
Caption: Figure 2.
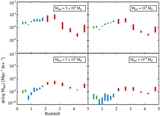
Posterior predictive check comparing the actual distribution of luminosities for our sample (solid histogram) with the set of distributions generated by our black hole mass and Eddington ratio functions (red squares with error bars). The error bars contain 68% of the posterior probability. The distributions of luminosities generated by our model are consistent with the observed distributions, showing that our model provides an acceptable fit.
Other Images in This Article
Show More
Copyright and Terms & Conditions
© 2013. The American Astronomical Society. All rights reserved.
Copyright ©
2026 Astronomy Image Explorer. All Rights Reserved.