Image Details
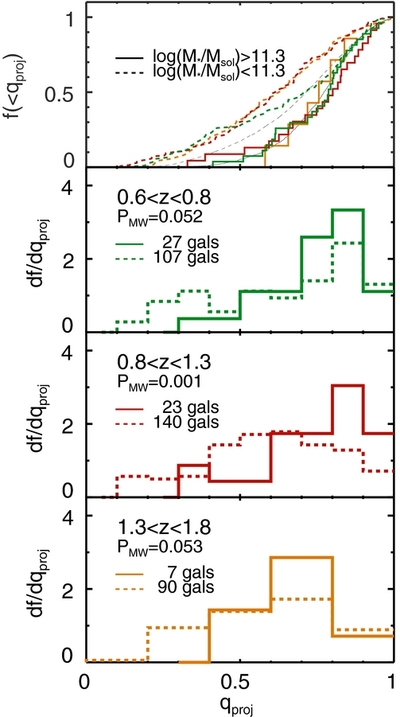
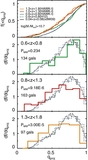
Caption: Figure 8.
Axis-ratio histograms of early-type galaxies with masses 10.7 < log ( M/ M ☉) < 11.3 (dashed lines) and early-type galaxies with masses log( M/ M ☉) > 11.3 (solid lines). The bottom panels show the distributions ( df/ dq proj) of different redshift bins, as indicated; the top panel combines all redshift bins and shows the cumulative histograms as a function of projected axis ratio ( f(< q proj), where the color coding corresponds to redshift, following the color coding in the bottom panels. The top panel also shows in black the SDSS-based sample of local early-type galaxies from H12 in the same mass range. At all redshifts the most massive galaxies are the roundest; the significance of this observation is confirmed by the M-W statistical test (as indicated by the listed probabilities that the samples are statistically the same).
Other Images in This Article
Copyright and Terms & Conditions
© 2013. The American Astronomical Society. All rights reserved.