Image Details
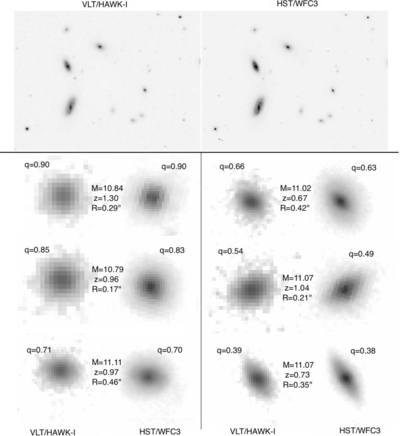
Caption: Figure 1.
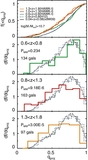
Comparison between VLT/HAWK-I imaging (top left) used for the analysis in this paper and HST/WFC3 imaging (top right; ERS data from Windhorst et al. 2011) of the same galaxies. The bottom panels show zoomed-in versions of the images of the HAWK-I and WFC3 images of six early-type galaxies in the redshift, stellar mass range of interest, and circularized half-light radii of HAWK-I, as indicated. Each panel is about 2'' on a side. These examples indicate that the resolution and depth of the HAWK-I imaging are sufficient to infer the projected axis ratio q, consistent with the values obtained from the WFC3 images.
Other Images in This Article
Copyright and Terms & Conditions
© 2013. The American Astronomical Society. All rights reserved.