Image Details
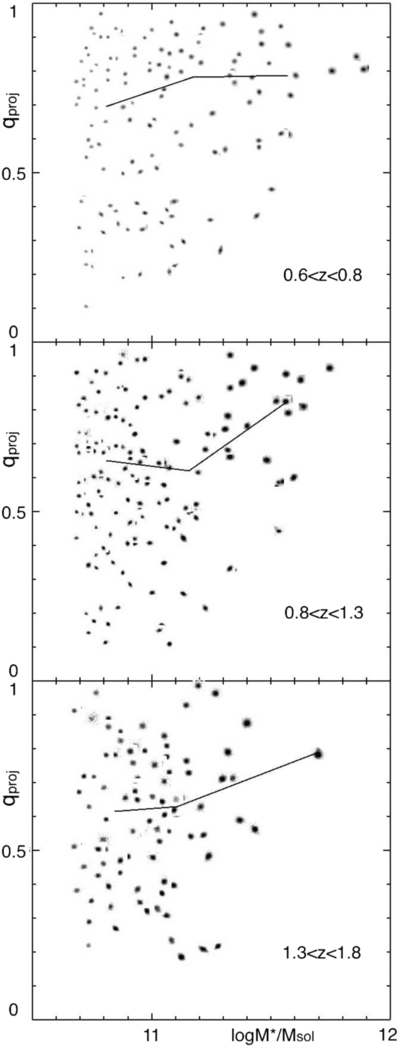
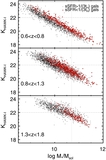
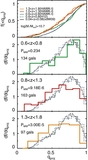
Caption: Figure 7.
Projected axis ratio vs. stellar mass for our early-type galaxy sample, split into three redshift bins. The symbols are the HAWK-I K-band images of the galaxies. The lines represent running median values of the axis ratio. Up to our highest redshift bin, the most massive galaxies appear to be the roundest (see also Figure 8 and Section 3.1). Overall, the galaxies in the highest redshift bins are also flatter than their lower redshift counterparts (see also Figure 9 and Section 3.2).
Other Images in This Article
Copyright and Terms & Conditions
© 2013. The American Astronomical Society. All rights reserved.
Copyright ©
2025 Astronomy Image Explorer. All Rights Reserved.