Image Details
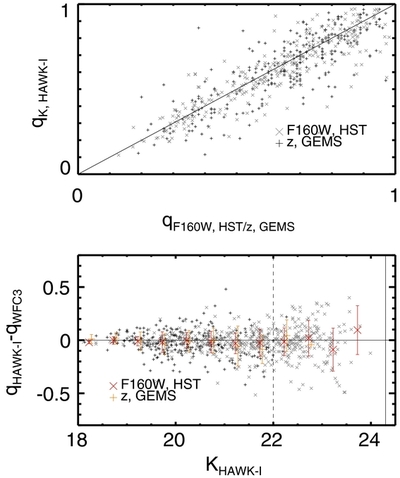
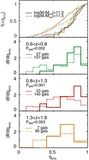
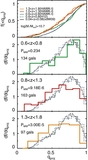
Caption: Figure 2.
Comparison of axis-ratio measurements from the HAWK-I K band and HST imaging. The crosses represent the comparison with measurements from WFC3 F160W imaging for a HAWK-I K-band-selected sample (regardless of galaxy type and redshift). The plus signs represent the comparison with measurements from HST/ACS F850LP of the H12 sample, which includes early-type galaxies in the redshift range 0.6 < z < 0.8. The top panel directly compares the VLT and HST axis-ratio measurements; the bottom panel shows the difference between the VLT and HST measurements as a function of HAWK-I K-band magnitude. The red and orange bars represent the median and standard deviation for a series of magnitude bins. The standard deviation represents the measurement uncertainty in the VLT-inferred axis ratio, assuming the HST-based value as "truth." For galaxies, regardless of type, brighter than K = 22 the uncertainty is smaller than or equal to 0.1, and we adopt this as the magnitude limit for our study. Interestingly, the accuracy of the axis-ratio measurement is good down to at least K ~ 24; systematic effects in the axis-ratio measurements are small compared to the random uncertainty.
Other Images in This Article
Copyright and Terms & Conditions
© 2013. The American Astronomical Society. All rights reserved.