Image Details
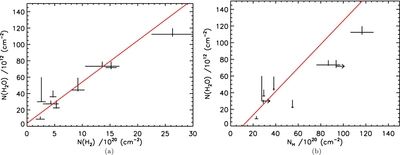
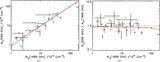
Caption: Figure 9.
Total column density of water as a function of the column density of molecular hydrogen and hydrogen nuclei. (a) The red solid line is the best linear fit to the data. (b) The red solid line is the best linear fit to the data. Arrows show the features for which we only have a lower limit for N H.
Other Images in This Article


Show More
Copyright and Terms & Conditions
© 2013. The American Astronomical Society. All rights reserved.
Copyright ©
2025 Astronomy Image Explorer. All Rights Reserved.