Image Details
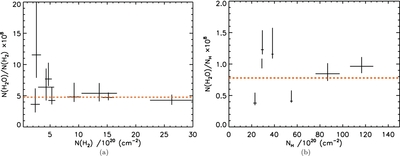
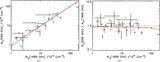
Caption: Figure 10.
Abundance of water relative to molecular hydrogen and hydrogen nuclei as a function of N(H 2) or N H. (a) The dashed orange line is the average of the data. (b) The dashed orange line is the average of the data.
Other Images in This Article


Show More
Copyright and Terms & Conditions
© 2013. The American Astronomical Society. All rights reserved.
Copyright ©
2025 Astronomy Image Explorer. All Rights Reserved.