Image Details
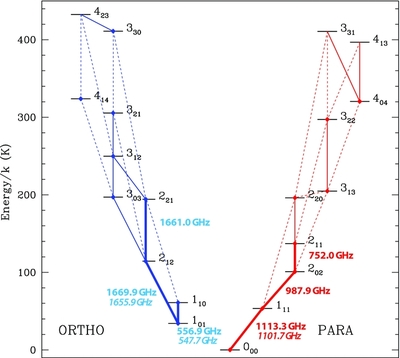
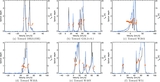
Caption: Figure 2.
Energy level diagram for ortho and para water. The transitions within the HIFI spectral coverage are indicated by solid lines, while those outside of this range are indicated by dashed lines. The transitions observed in PRISMAS are indicated by heavy lines, labeled with the frequency of H 2 16O and H 2 18O (in italics) when observed.
Other Images in This Article


Show More
Copyright and Terms & Conditions
© 2013. The American Astronomical Society. All rights reserved.
Copyright ©
2025 Astronomy Image Explorer. All Rights Reserved.