Image Details
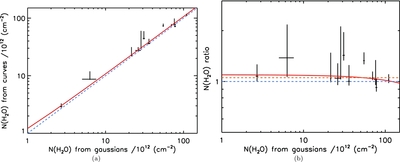
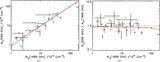
Caption: Figure 5.
Comparison between the total column density of H 2O inferred from the Gaussian profiles and from the column density curves. Each data point represents one absorption feature group. In each panel, the red solid line is the best linear fit to the data, the blue dashed line is a column density ratio equal to unity, and the orange dashed line is the average column density ratio.
Other Images in This Article


Show More
Copyright and Terms & Conditions
© 2013. The American Astronomical Society. All rights reserved.
Copyright ©
2025 Astronomy Image Explorer. All Rights Reserved.