Image Details
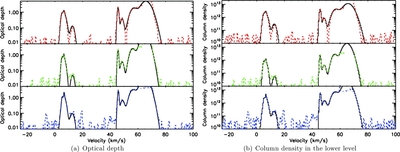
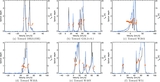
Caption: Figure 4.
Optical depth and column density in the lower level for the ground state H 2O transitions toward W51. In each panel, the black solid line is inferred from the Gaussian components and the colored dashed line is derived from the interpolated continuum. The optical depth is shown at the native velocity resolution of the spectrum while the column density is shown with a common velocity bin of 0.5 km s −1. The top, middle, and bottom panels show the 556, 1113, and 1669 GHz transitions, respectively.
Other Images in This Article


Show More
Copyright and Terms & Conditions
© 2013. The American Astronomical Society. All rights reserved.
Copyright ©
2025 Astronomy Image Explorer. All Rights Reserved.