Image Details
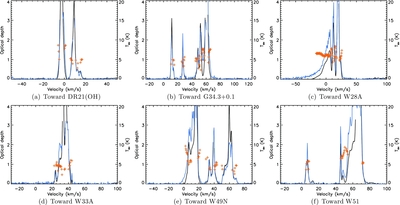
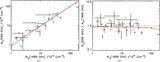
Caption: Figure 7.
Comparison between the optical depth derived from the 556 GHz (in black) and the 1669 GHz (in blue) transitions under the low T ex assumption. The values of T ex (right y-axis) required to make these optical depths consistent are indicated by the orange crosses over the regions where the optical depth is between 0.1 and 2.5.
Other Images in This Article


Show More
Copyright and Terms & Conditions
© 2013. The American Astronomical Society. All rights reserved.
Copyright ©
2025 Astronomy Image Explorer. All Rights Reserved.