Image Details
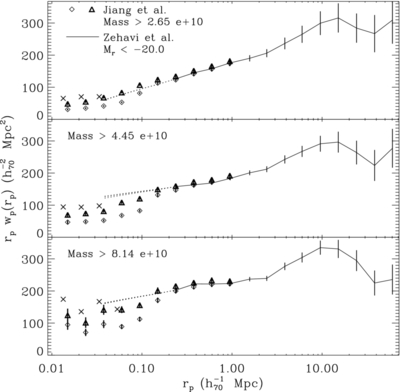
Caption: Figure 22.
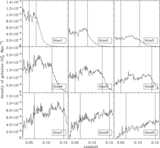
Projected correlation function w p( r p) same as Figure 21, but only display the last three plots. The black crosses in the second and third plots are our result before photometry correction, which are offseted by 12% of our interval to the left. Please note that the three extension dashed lines are fitting from the first five, first six, and first seven data points of Zehavi et al. (2011).
Other Images in This Article
Show More
Copyright and Terms & Conditions
© 2012. The American Astronomical Society. All rights reserved.
Copyright ©
2025 Astronomy Image Explorer. All Rights Reserved.