Image Details
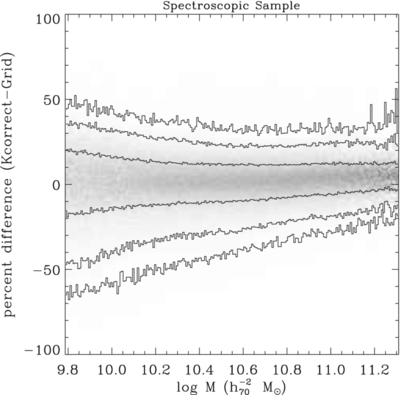
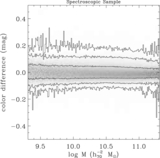
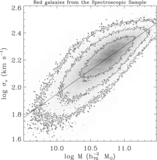
Caption: Figure 7.
Difference between the K-correct-estimated stellar mass and the stellar mass estimated by the Grid Method. The contours show the 68%, 95%, and 99% intervals. The gray scale reflects the number of galaxies in each bin.
Other Images in This Article
Show More
Copyright and Terms & Conditions
© 2012. The American Astronomical Society. All rights reserved.
Copyright ©
2025 Astronomy Image Explorer. All Rights Reserved.