Image Details
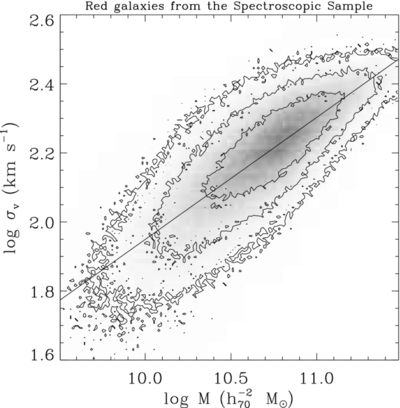
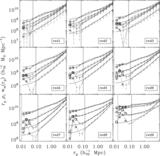
Caption: Figure 9.
Relationship between σ v , the stellar velocity dispersion and M, the stellar mass for red galaxies in the spectroscopic sample. The gray scale and the contours reflect the number of galaxies in each bin. The solid line is the linear fit, Equation (6).
Other Images in This Article
Show More
Copyright and Terms & Conditions
© 2012. The American Astronomical Society. All rights reserved.
Copyright ©
2025 Astronomy Image Explorer. All Rights Reserved.