Image Details
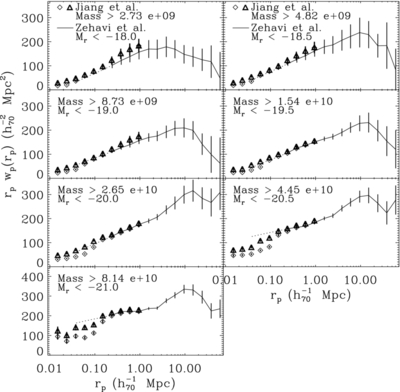
Caption: Figure 21.
Projected correlation function w p( r p) same as Figure 20. There is no offset in this graph. The triangle points are our w p( r p) with correction of fiber collisions, the diamond points are the w p( r p) assuming p j = 1 and f j = 1, the solid lines with thin error bars are the w p( r p) of Zehavi et al. (2011), and the dashed lines are the extension lines of Zehavi et al. (2011) described in the text. Please note that in order to compare these results easily, we only display our first 10 data points.
Other Images in This Article
Show More
Copyright and Terms & Conditions
© 2012. The American Astronomical Society. All rights reserved.
Copyright ©
2025 Astronomy Image Explorer. All Rights Reserved.