Image Details
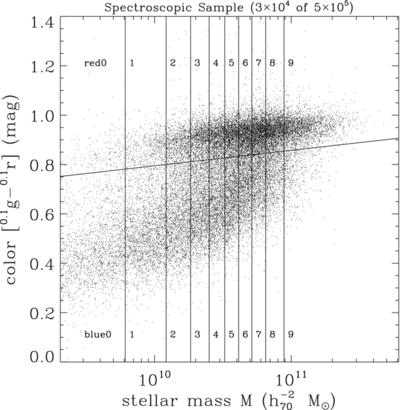
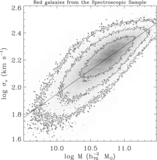
Caption: Figure 2.
Distribution of the spectroscopic subsample in color and K-correct-estimated stellar mass. The nearly horizontal line separates galaxies into red and blue; the vertical lines separate galaxies into 10 subsamples with different stellar mass. For clarity, only a randomly chosen subsample of 3 × 10 4 points is shown.
Other Images in This Article
Show More
Copyright and Terms & Conditions
© 2012. The American Astronomical Society. All rights reserved.
Copyright ©
2025 Astronomy Image Explorer. All Rights Reserved.